
In this post, we’ll give an introductory explanation to machine learning that explains how robots learn. Machine learning is the study of computer programs to automatically improve through experience. It is used today by self driving cars, robots that pick up & move objects, weather and home price prediction and more.
What are the common types of machine learning?
There are three common types of machine learning:
Supervised Learning: Machine learning where the algorithm is trained on labeled data to predict or map input features to corresponding output labels.
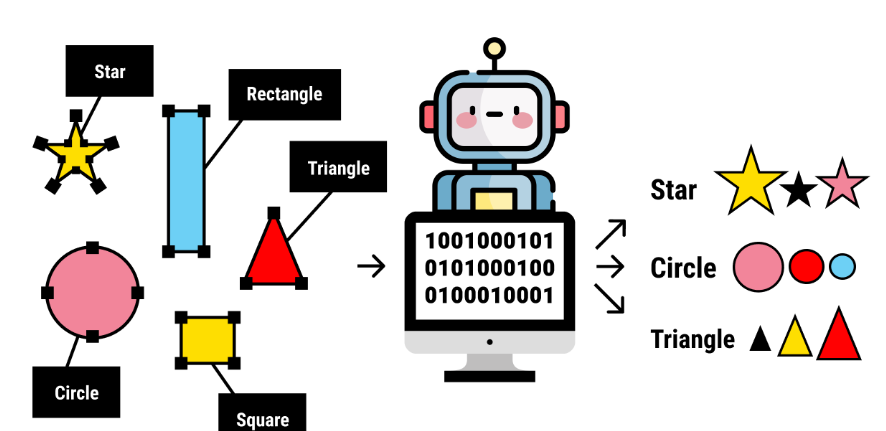
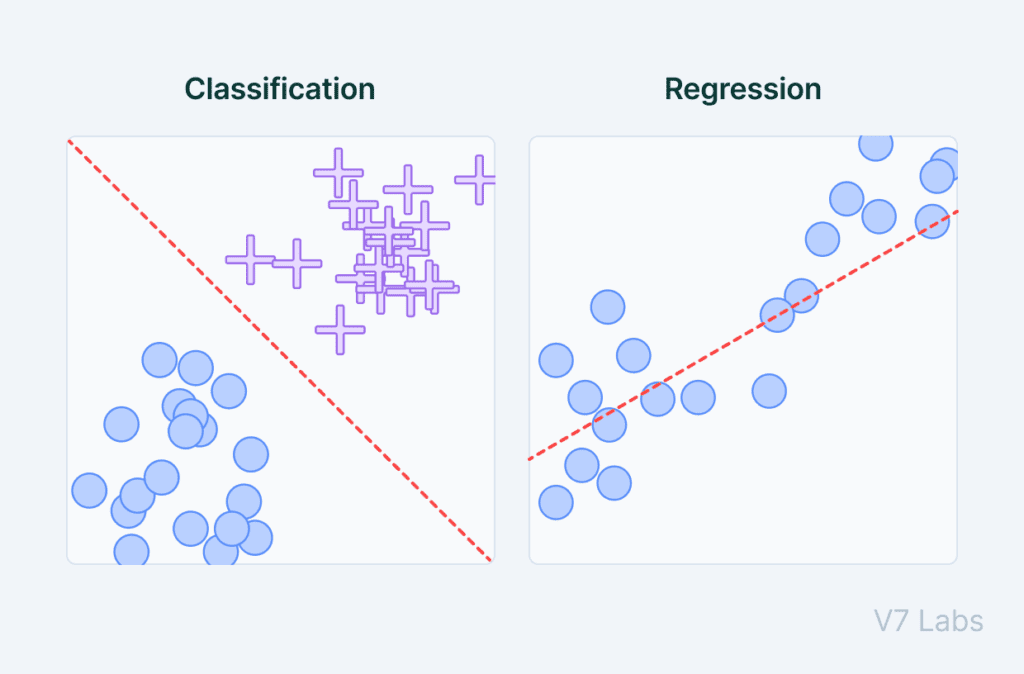
One of the common supervised learning use cases is classification and regression. Classification allows us to “classify” inputs into specific outputs, i.e dogs or cats when given an input image. Regression allows us to find an underlying model that corresponds to data points we have seen before, allowing us to roughly predict data we have not seen before:
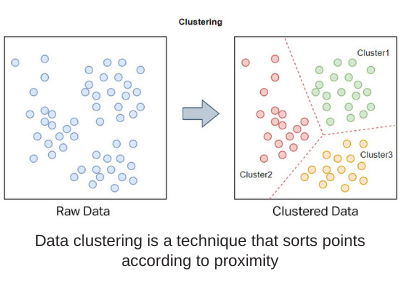
The second common type of machine learning is known as Unsupervised Learning: Machine learning where the algorithm explores and identifies patterns or structures in unlabeled data without specific guidance.
A common unsupervised learning use case is known as clustering, where you can sort data into groups given some clusters, which may provide some degree of association and information about the data in each cluster (i.e height and likelihood to play in the NBA):
The third common type of machine learning is Reinforcement Learning: Machine learning where an agent learns to make decisions through trial and error in an environment, receiving feedback in the form of rewards or penalties to improve its actions over time.
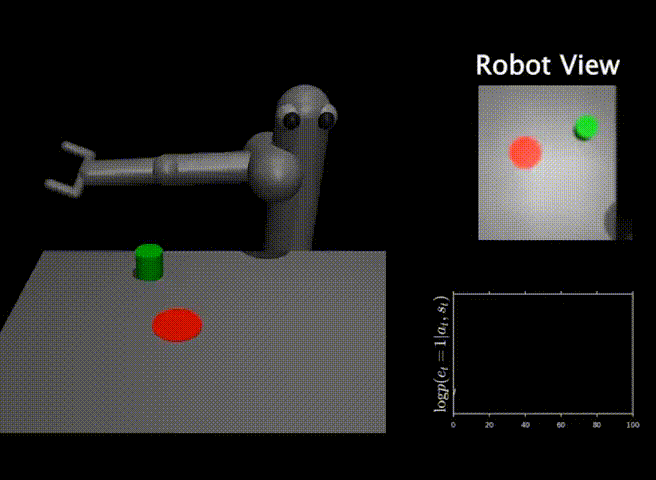
A robot can “learn” to move a green cylinder into a red circle by being rewarded if it does. An objective function, such as how close the green cylinder is to the red circle, mathematically encodes how much of a “reward” the robot receives, the higher the reward the better!
Supervised Machine Learning Example: Prediction
Given a lot of data and a measure of “correctness”, we can “train” a prediction function. Basic prediction from a linear regression if question is linear & 2 dimensional (x,y) (i.e your question has two variables, how hot is it depending on the number of clouds in the sky). We could predict how much force do you need to shoot a basket from a specific distance using a linear regression:
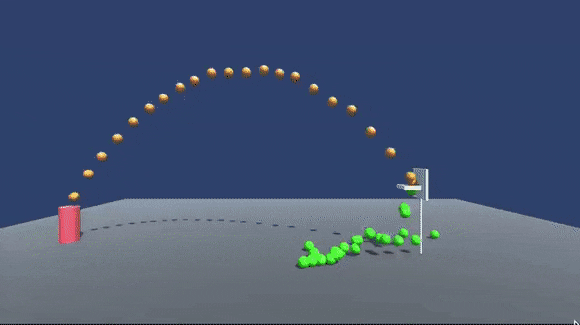
Consider a robot trying play basketball using machine learning:
- Rules: If the shooter is X distance away from the hoop, shoot the ball with Y force.
- Goal prediction: What force (Y) should we use for each distance (X) so that the ball goes in the hoop?
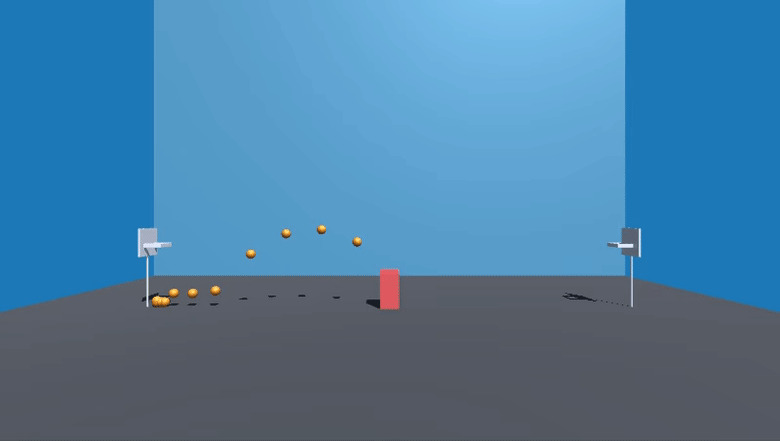
- When starting, we have no idea how much force we should use for each distance and miss most shots
- In the beginning with no data, you have no idea how much force is needed to make a basket:
- We shoot the ball randomly and we “learn” what shot went in the basket by recording force Y at distance X
- With enough shots made, a linear regression (finding a line from a set of points) can predict how much force is needed for any distance!
- Good for problems with a 2D (x/y) representation and linear solution, as a line is represented with the equation y=mx+b, the linear regression finds the best m and b that gets as close as possible to the points we consider solutions (i.e baskets made). These set of solution points can be thought of as our training data.
- Consider graphing all the successful baskets force (y) and distance (x). We would find that most shots fall on a specific line (the “optimal” solution of force for a given distance guaranteed to make the basket):
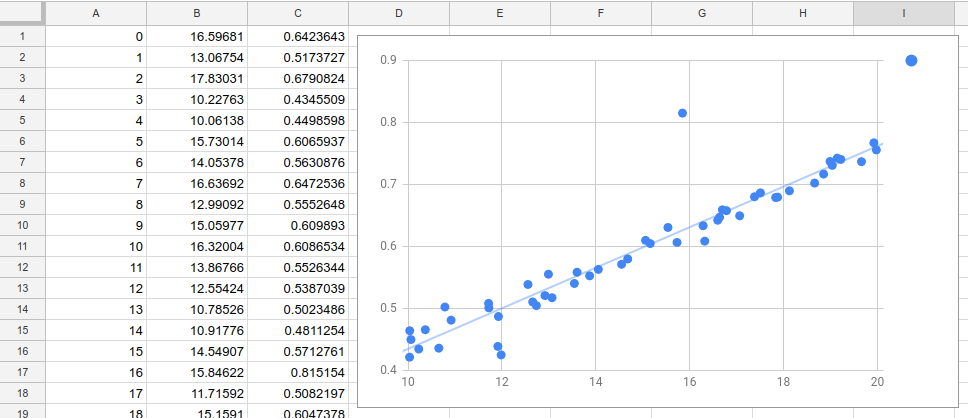
- The linear regression line finds the solution with points we labeled/recorded as “distance/forces” that resulted in a basket. With enough of these points, the robot can learn the perfect force to make a basket from any distance!
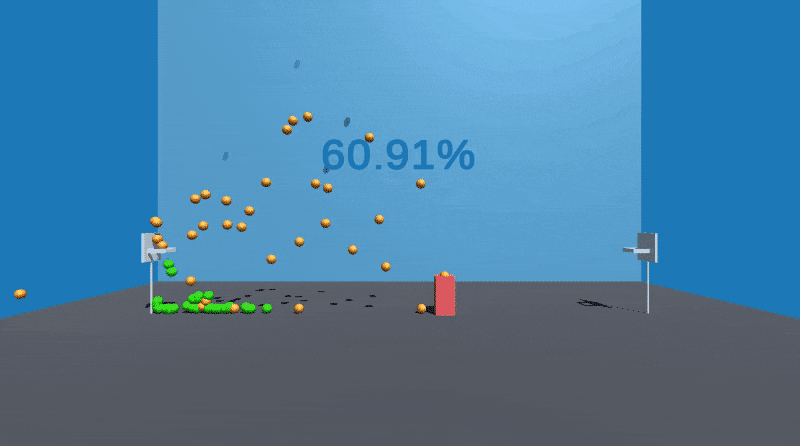
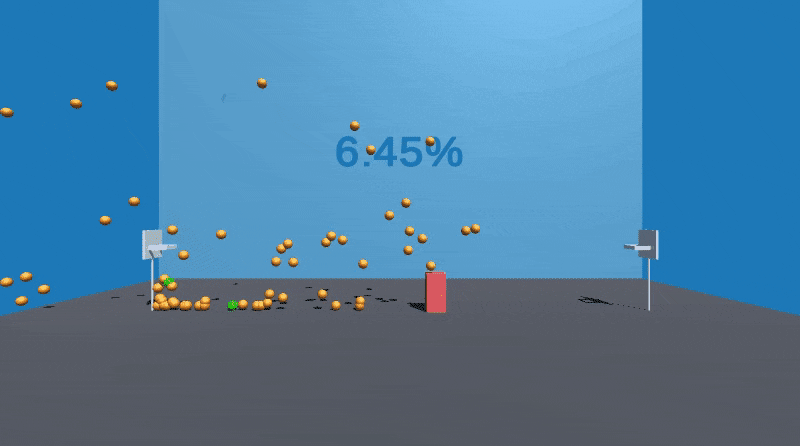
As we shoot more baskets and update our linear regression (line prediction), we keep improving our prediction and increasing the percentage of shots that go in! We can visualize our improvement over time as well.
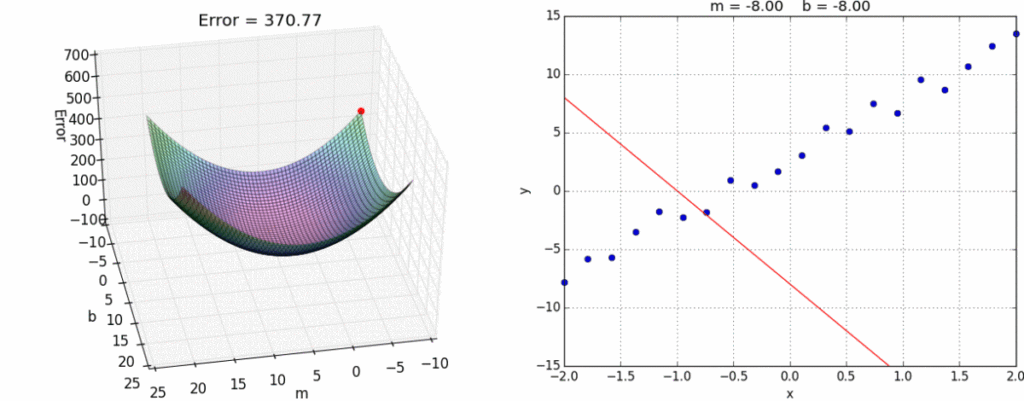
- Visualizing the prediction (red line) over time as error is reduced by recording more baskets distance & force, the linear regression line becomes more accurate / optimal.
On the left we see the gradient descent visualized as we minimize error (misses) by taking more shots.
Playing basketball perfectly using machine learning
- Once we have enough data by taking enough practice shots and recording (labeling) shots that went in, we will have found a line that predicts the proper force (Y) even for distances (X) we had not previously attempted
- With enough data, we were able to interpolate the optimal function that reflects the game physics
- Note this key limitation: basic linear regressions only work for predicting outcomes that can actually be modeled with a linear equation.
We hope with this guide, you have learned a little about how a robot learns, using machine learning techniques. We hope you also learned specifically about how a linear regression can be used to make a prediction given enough data.


